 Page top
 Previous
 Homepage
 Next
Next
Stacked Bar Graph
Description
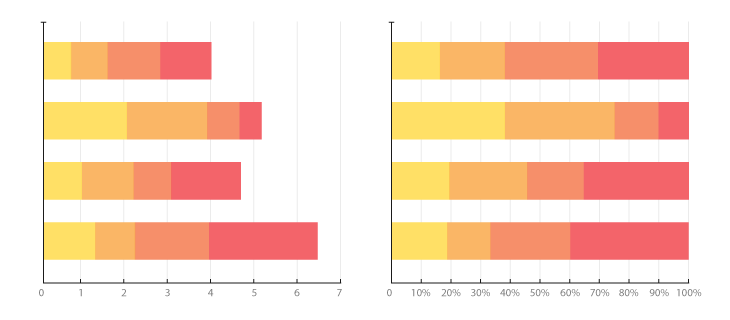
Unlike a Multiset Bar Graph which displays the bars side-by-side for multiple data series, Stacked Bar Graphs segment the bars on top of each other. They are used to show how a larger category is divided into smaller subcategories and what the relationship of each part has on the total amount. There are two types of Stacked Bar Graphs:
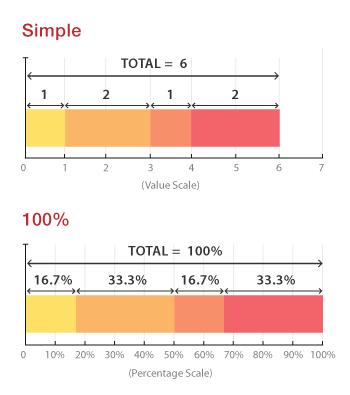
Simple Stacked Bar Graphs place each value for the segment after the previous one. The total value of the bar is all the segment values added together. Ideal for comparing the total amounts across each segmented bar.
100% Stack Bar Graphs show the percentage-of-the-whole by plotting the percentage of each value to the total amount in each group. This makes it easier to see the relative differences between quantities in each group.
One major flaw of Stacked Bar Graphs is that they become harder to read the more segments each bar has. Also, comparing each segment to the other is difficult, as they're not aligned on a common baseline.
Functions
When 100% Stacked Bar Graph:
Anatomy


Tools to Generate Visualisation
Code-based:
amCharts (JS)
AnyChart (JS)
CanvasJS (JS)
D3.js Graph Gallery (D3.js)
FusionCharts (JS)
Google Charts (HTML5)
JSCharting (JS)
Plotly (JS)
Python Graph Gallery (matplotlib)
R Graph Gallery (ggplot2)
Vega
Vega-Lite
ZingChart (JS)
ZoomCharts (JS)
Webapp:
Datavisual
Datawrapper
Datylon
Flourish
Google Docs
Infogram
plotDB
Slemma
Vizzlo
Desktop App:
Adobe Illustrator
Apple Numbers
Microsoft Office, PowerBI
Tableau
Check out our fast-paced, data visualisation-themed card game:

Merchandise & other related dataviz products can be found at the store.

