 Page top
 Previous
 Homepage
 Next
Next
Spiral Plot
Description
Also known as a Time Series Spiral.
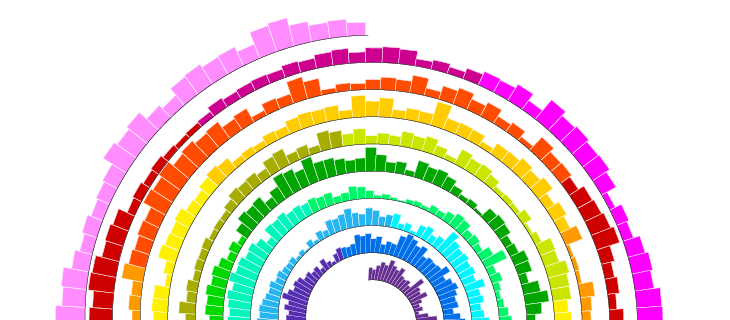
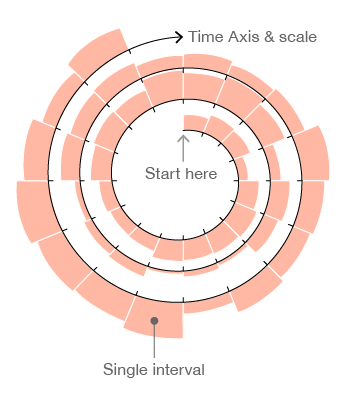
This visualisation plots time-based data along an Archimedean spiral. The graph begins at the centre of the spiral and then progresses outwards. Spiral Plots are versatile and can plot bars, lines or points along the spiral path.
Spiral Plots are ideal for showing large data sets, usually to show trends over a large period of time. Therefore, Spiral Plots are great for displaying periodic patterns. Colour can be assigned to each period to break them up and to allow some comparison between each period. So, for example, if we were to show data over a year, we could assign a colour for each month on the graph.
- - -
Papers on the development of Spiral Plots:
Interactive Visualization of Serial Periodic Data - John V. Carlis and Joseph A. Konstan (1998)
Visualizing Time-Series on Spirals, Marc Weber, Marc Alexa and Wolfgang Müller (2001)
Functions
Anatomy
Similar Charts
...Tools to Generate Visualisation
Code-based:
Arpit Narechania’s Block (D3.js)
Stack Overflow Entry (R: ggplot + coord_polar)
Webapp:
Charticulator
Examples
...Check out our fast-paced, data visualisation-themed card game:

Merchandise & other related dataviz products can be found at the store.

