 Page top
 Previous
 Homepage
 Next
Next
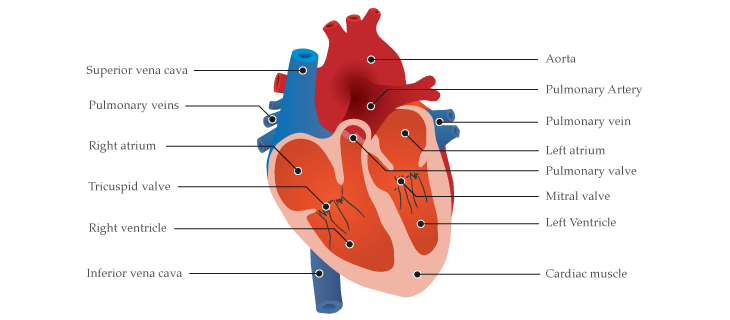
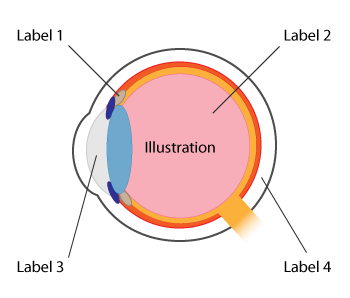
Illustration Diagram
Description
Illustration Diagrams are graphics that display an image, or images, accompanied by either notes, labels or a legend, in order to:
Explain concepts or methods
Describe objects or places
Show how things work, move or change
Help provide additional insight into the subject displayed
Images used can come in the form of illustrations, rough sketches, wire-frames or photographs. Therefore, images can be either symbolic, pictorial or realistic. Sometimes enlargements and cross-sections are used for more in-depth analysis or displaying more detail.
Functions
Concepts
How things work
Processes & Methods
Anatomy
Variations
...Tools to Generate Visualisation
Any image-making tool. Adobe Illustrator or CorelDRAW are popular options.
Examples
...Check out our fast-paced, data visualisation-themed card game:

Merchandise & other related dataviz products can be found at the store.

